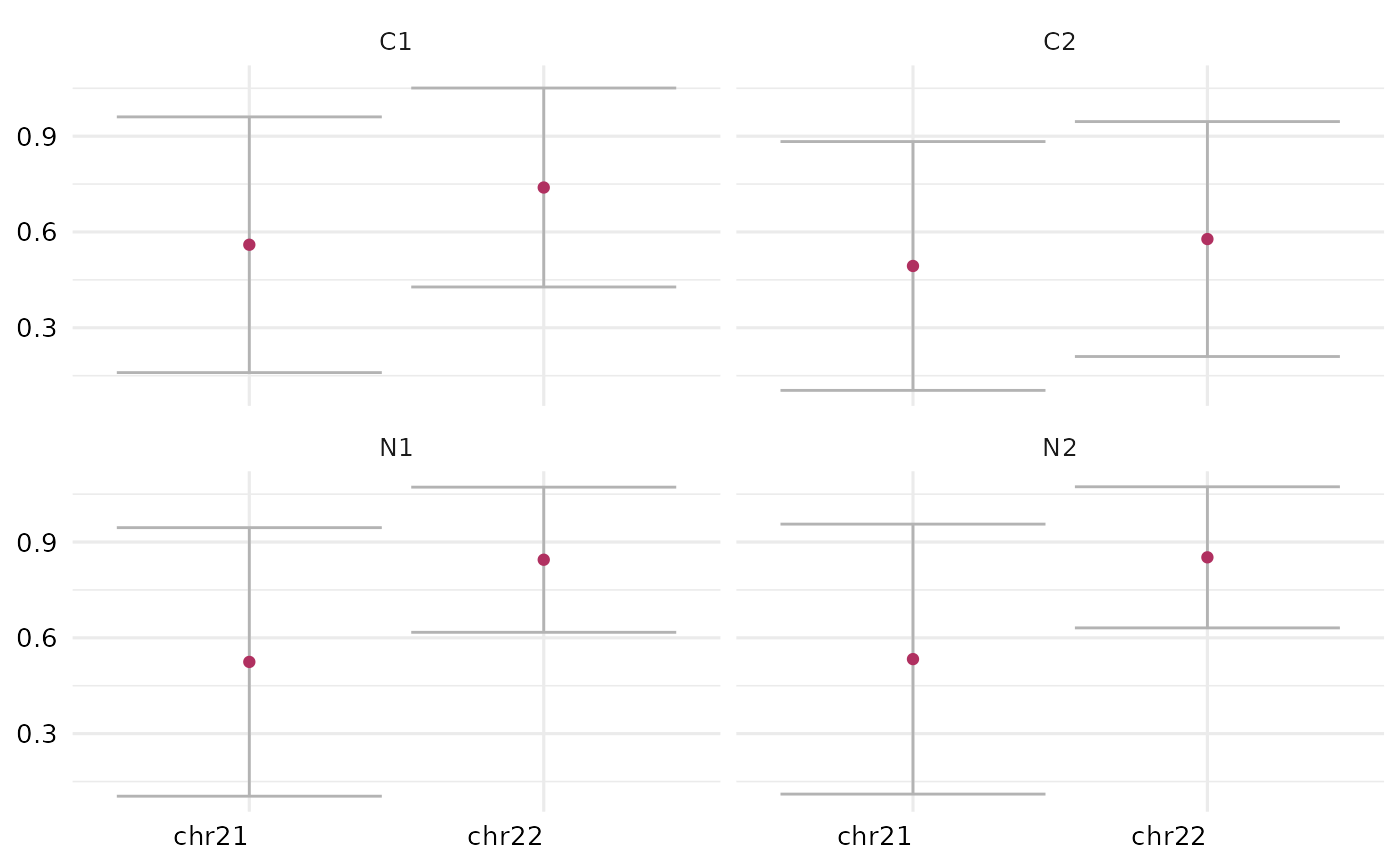
Plot descriptive statistics
plot_stats.RdPlot descriptive statistics
plot_stats(
  plot_dat,
  what = "M",
  stat = "mean",
  ignore_chr = NULL,
  samples = NULL,
  n_col = NULL,
  n_row = NULL
)
Arguments
| plot_dat | results from |
|---|---|
| what | Can be |
| stat | Can be |
| ignore_chr | Chromsomes to ignore. Default |
| samples | Use only these samples. Default |
| n_col | number of columns. Passed to `facet_wrap` |
| n_row | number of rows. Passed to `facet_wrap` |
Value
ggplot2 object
Details
plot descriptive statistics results from get_stats
See also
Examples
#>plot_stats(gs)