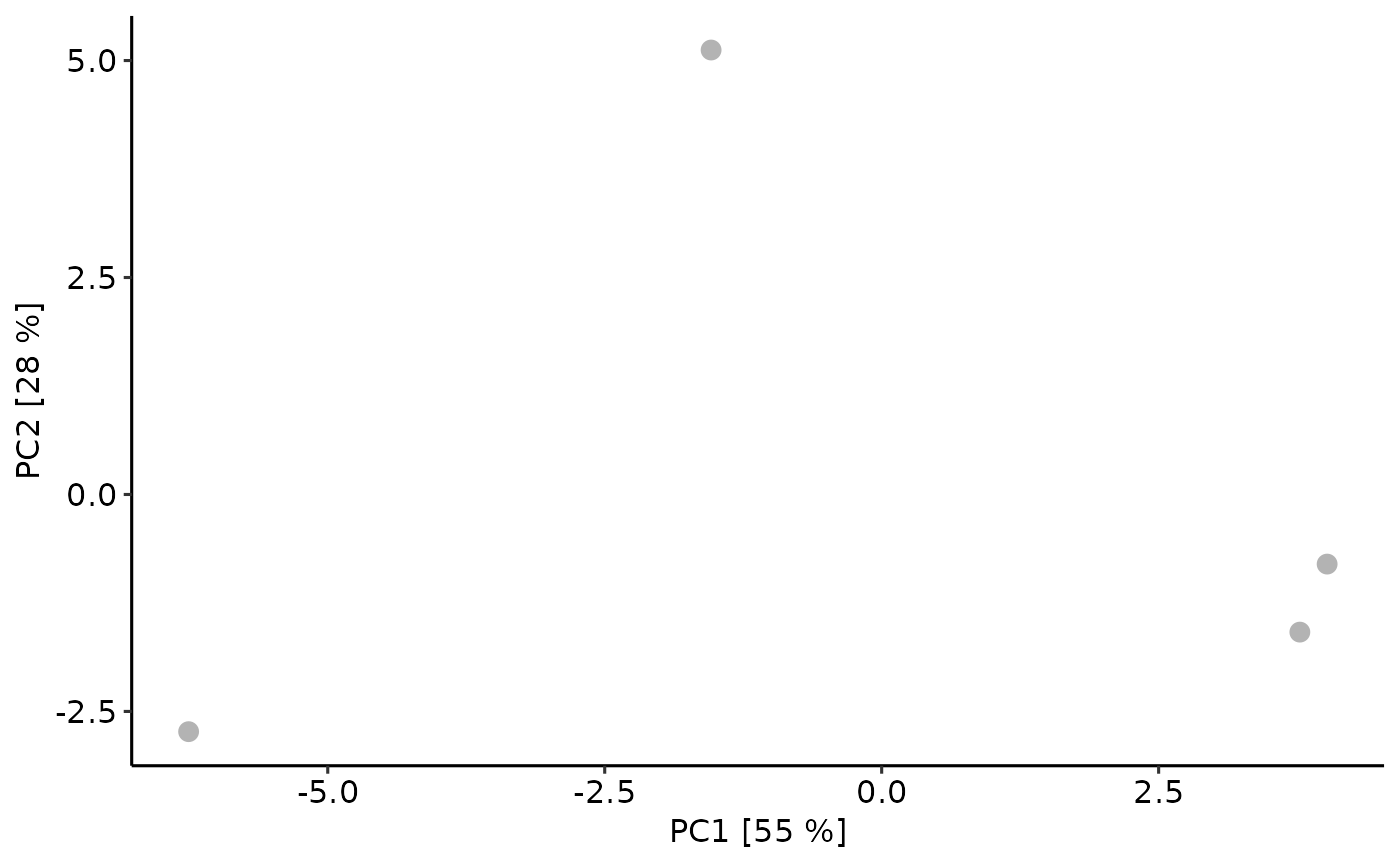
Plot PCA results
plot_pca.RdPlot PCA results
plot_pca(
  pca_res,
  m = NULL,
  col_anno = NULL,
  shape_anno = NULL,
  pc_x = "PC1",
  pc_y = "PC2",
  show_labels = FALSE
)
Arguments
| pca_res | Results from |
|---|---|
| m | optinal methrix object. Default NULL |
| col_anno | Column name of colData(m). Default NULL. Will be used as a factor to color different groups. Required |
| shape_anno | Column name of colData(m). Default NULL. Will be used as a factor to shape different groups. Required |
| pc_x | Default 'PC1' |
| pc_y | Default 'PC2' |
| show_labels | Default FLASE |
Value
ggplot2 object