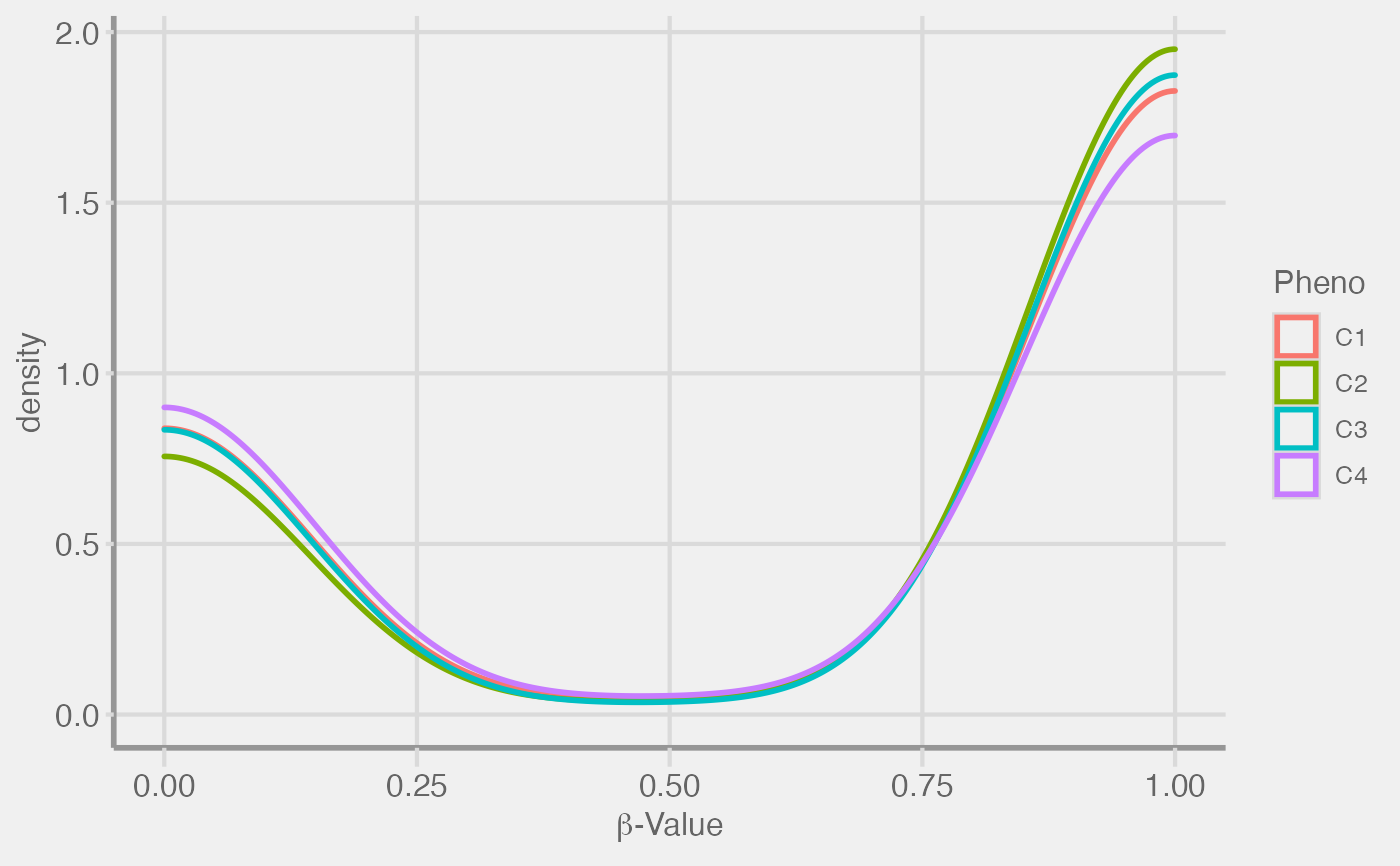
Density Plot of \(\beta\)-Values
plot_density(
  scm = NULL,
  assay = "score",
  regions = NULL,
  n_cpgs = 25000,
  pheno = NULL,
  col_palette = "RdYlGn",
  show_legend = TRUE,
  verbose = TRUE
)
Arguments
| scm |
|
|---|---|
| assay | string; name of an existing assay. Default = "score" |
| regions | Granges; genomic regions to be summarized. Could be a data.table with 3 columns (chr, start, end) or a |
| n_cpgs | integer; Use these many random CpGs for plotting. Default 25000. Set it to |
| pheno | string; Col name of colData(m). Will be used as a factor to color different groups |
| col_palette | string; Name of the RColorBrewer palette to use for plotting. |
| show_legend | boolean; Display the legend on the plot |
| verbose | boolean; Flag for outputting function status messages. Default = TRUE |
Value
ggplot2 object
Examples
#>#>#>#>