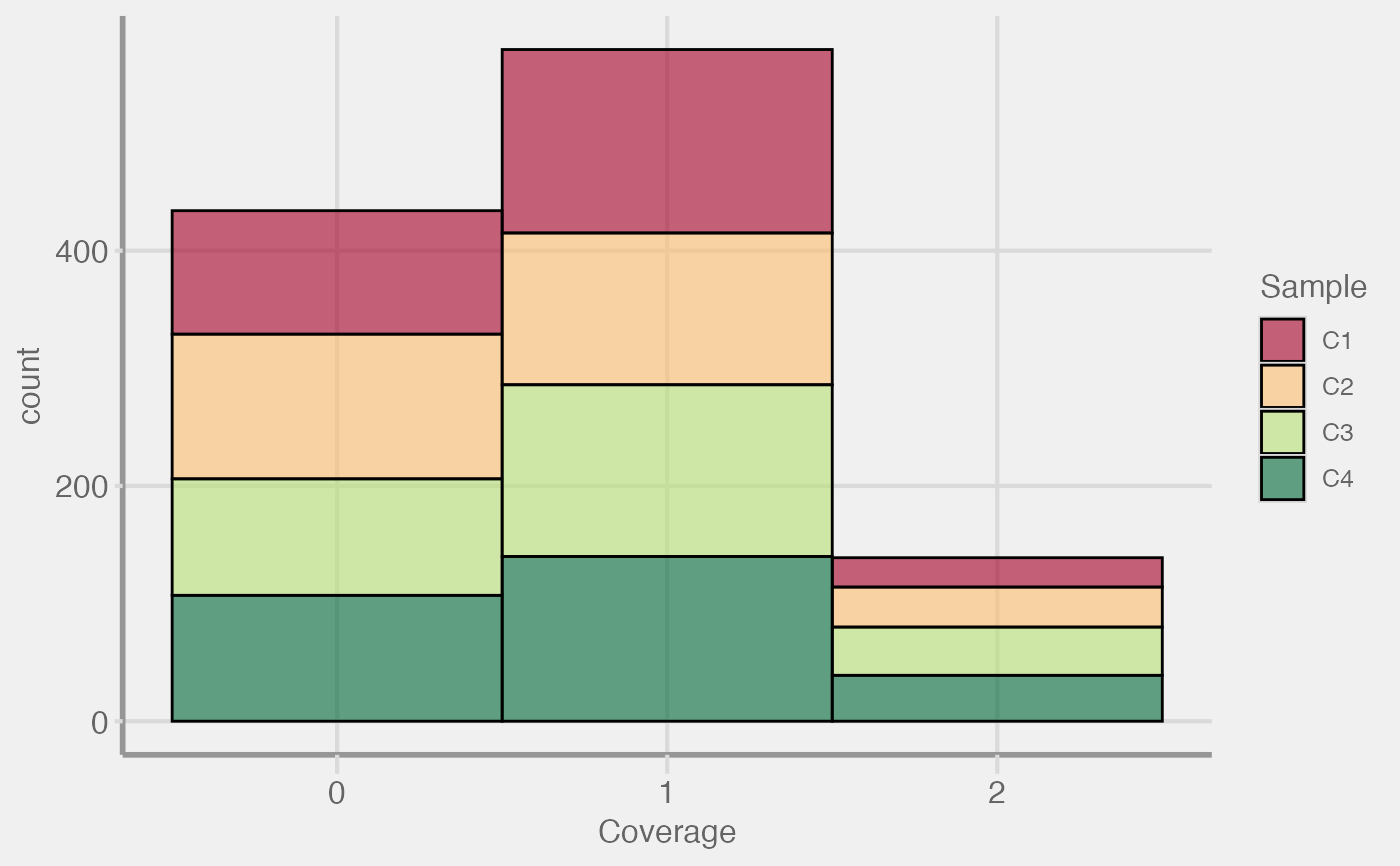
Coverage QC Plots
plot_coverage(
  scm = NULL,
  type = c("histogram", "density"),
  pheno = NULL,
  max_cov = 100,
  obs_lim = 1e+06,
  col_palette = "RdYlGn",
  show_legend = TRUE,
  verbose = TRUE
)
Arguments
| scm |
|
|---|---|
| type | string; Choose between 'histogram' (histogram) or 'density' (density plot). |
| pheno | string; Col name of colData(m). Will be used as a factor to color different groups |
| max_cov | integer; Maximum coverage value to be plotted. |
| obs_lim | integer; The maximum number of observations (sites*samples) to use. If the dataset is larger that this, random sites will be selected from the genome. |
| col_palette | string; Name of the RColorBrewer palette to use for plotting. |
| show_legend | boolean; Display the legend on the plot |
| verbose | boolean; Flag for outputting function status messages. Default = TRUE |
Value
ggplot2 object
Examples
#>